BIO00056I
Directed study 12 (worksheet): Comparative genomics
1 Learning objectives
This worksheet aims to:
- Help you to understand evolutionary changes in genomes between species
- Provide a chance to learn to interpret phylogenetic trees
- And we consider gene gain and loss over a clade of species, a type evolutionary changes in genomes that we
2 Introduction
Trypanosomatids are a clade of single celled eukaryotes that includes Leishmania parasites. Many Trypanosomatid species are parasites of humans and/or animals, so there is a strong motivation for understanding their evolution and adaptation. All Trypanosomatid species live in two hosts
- a vertebrate host (usually a mammal)
- an insect host (the vector)
One route of adaptation is the gradual divergence of genes by point mutations (SNPs), which leads to gradual changes in proteins. These random changes are affected by natural selection, which can lead to adaptation.
Another route is the loss or gain of entire genes, Figure 1 (below) shows that this gene gain or loss does occur.
3 The data
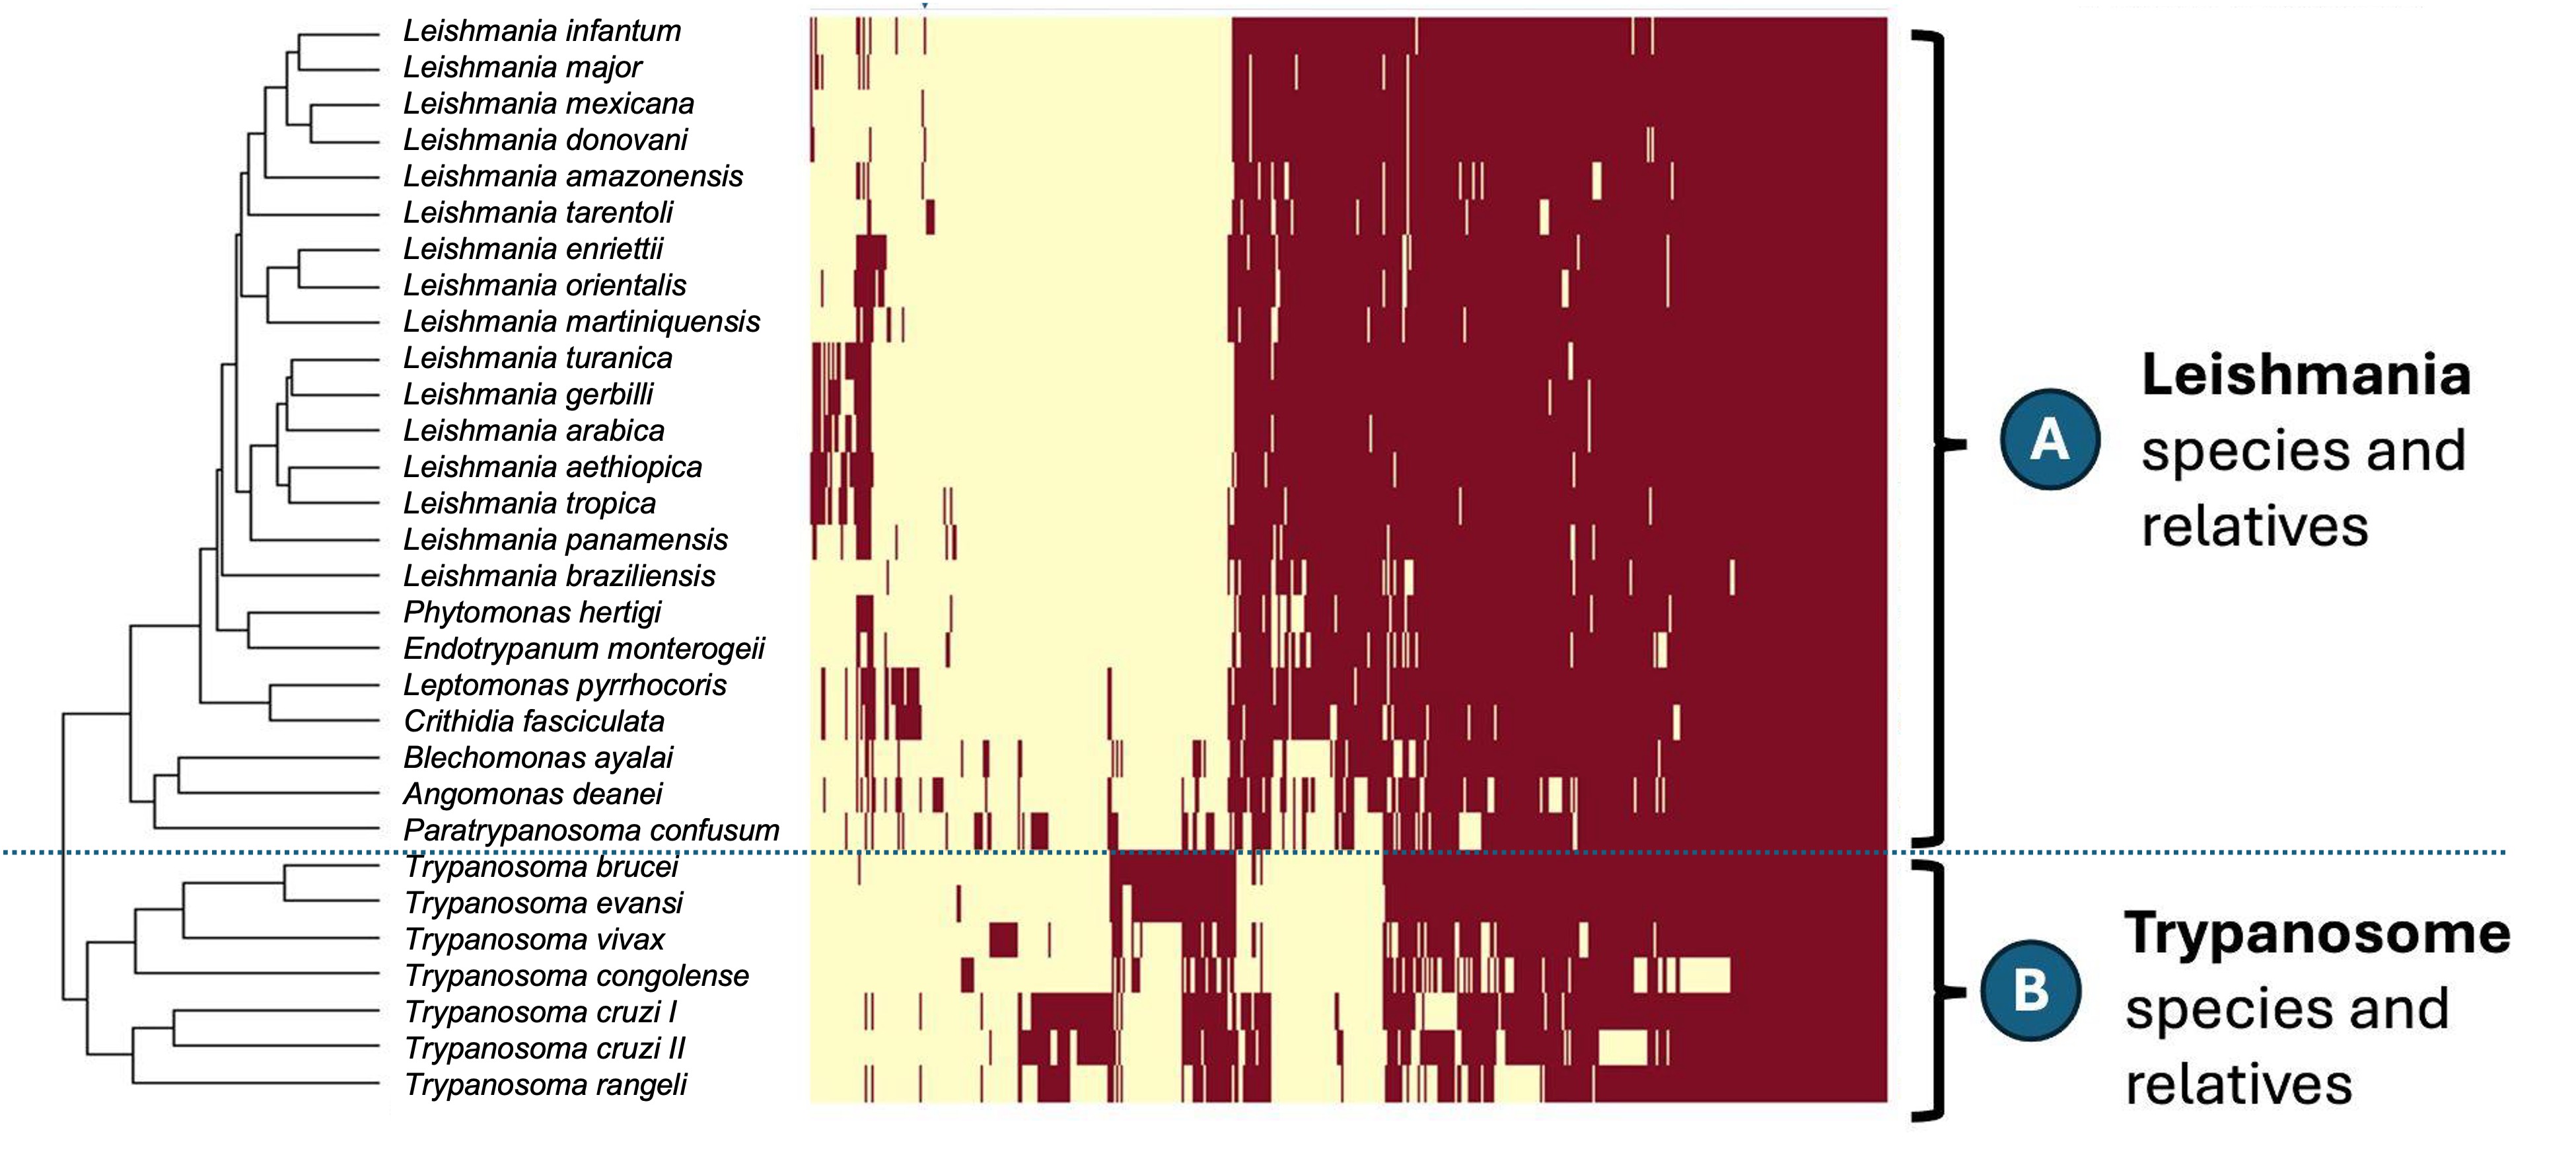
3.1 How we generated gene gain/loss data
This is comparative genomics data. We download the sequences of all the protein-coding genes of each of these species, from the databse TriTrypDB. We then found clusters of orthologous groups (ie: groups of orthologs), using the OrthoFinder software. OrthoFinder identifies the clusters of orthologous groups. The plot above does not show when a species has multiple copies of a gene in an orthologous group (paralogs).
Two genes are orthologs if they are in different species and have evolved from a common ancestral gene by speciation. Orthologous genes often retain the same function in the course of evolution.
Paralogs are like orthologs, in that they have evolved from a common ancestral gene, but they are in the same species and have arisen by gene duplication.
Orthologous groups are groups of genes from different species that are all orthologous to each other. An orthologous group may contain one gene from each species, or it may contain multiple genes from some species (paralogs).
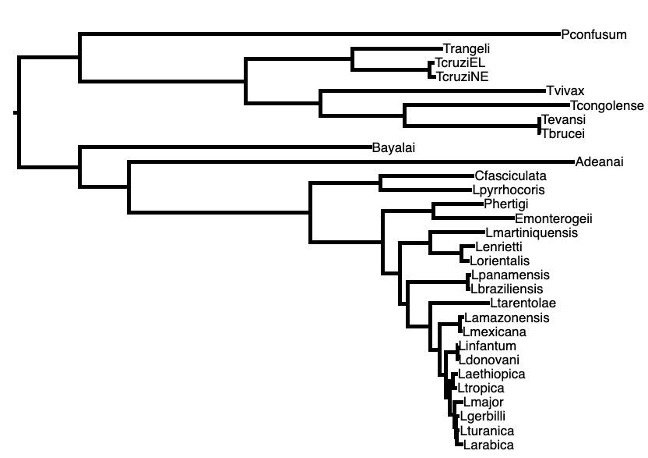
We can compare the cladogram of the Trypanosomatid species to Figure 2 (below), which is a phylogenetic tree drawn using the single nucleotide differences in ~1000 single copy genes (genes that every species has exactly one of). This phylogenetic tree will be very reliable, as it is created from tens of thousands of single nucleotide differences.
You will recall that we examined a phylogenetic tree of influenza viruses in workshop 5. The influenza virus phylogenetic tree spanned only a few years, whereas this Trypanosomatid tree spans millions of years.
But remember that within-population process (especially genetic drift and natural selection) give rise to the differences between species regardless of timescale. A big difference is that we expect many more differences to have accumulated over millions of years than over a few years.
4 The exam style questions
Question 1. Do Figure 1 and Figure 2 show the same tree topology?
Hint: You can check this by:
Checking that the two main divisions of species in Figure 1 and Figure 2 have the same members. This will provide a rough check of the two trees.
Examining closely related species pairs or sister groups that sit right next to each other on the tree in Figure 1. Checking that these sister groups are preserved in Figure 2. It might help to print them out and mark species pairs in the two figures.
- You won’t need to examine all the sister groups to find some that are not the same.
Question 2. What do you notice about the gene content of the two main clades of species (A and B) in Figure 1? If there is a pattern, what evolutionary processes that operate within species will influence this?
Question 3. Would you expect such changes to affect traits or fitness? If so, would you expect the average fitness change to be large or small?
5 Model answers
Question 1. Do Figure 1 and Figure 2 show the same tree topology?
While the two main clades contain the same members, these two phylogenetic trees do not have the same topology. For example, in Figure 1, Leishmania infantum and Leishmania major are sister species, but in Figure 2, Leishmania infantum is more closely related to Leishmania donovani.
Question 2. What do you notice about the gene content of the two main clades of species (A and B) in Figure 1? If there is a pattern, what evolutionary processes that operate within species will influence this?
There is a pattern: there is a large difference in the gene content between the two main clades. The Leishmania clade (A) has many genes that are absent from the Trypanosome clade (B), and vice versa. This suggests that there have been many gene gain and/or loss events since the two clades diverged from their common ancestor.
The evolutionary processes that operate within species that will influence this include:
- mutation, in this case the mutations will be gene gain/loss events
- genetic drift, which can lead to the fixation or loss of genes in small populations
- natural selection, which can favour the retention of beneficial genes and the loss of deleterious
Question 3. Would you expect such changes to affect traits or fitness? If so, would you expect the average fitness change to be large or small?
Yes, we would expect such changes to affect traits and fitness. However, since the majority of changes with genomes are selectively neutral, we would you expect the average fitness change to be small.
For example, experiments with yeast have showed that most gene deletions very small effect on fitness in laboratory conditions, causing less than 5% increase or decrease in growth rates.